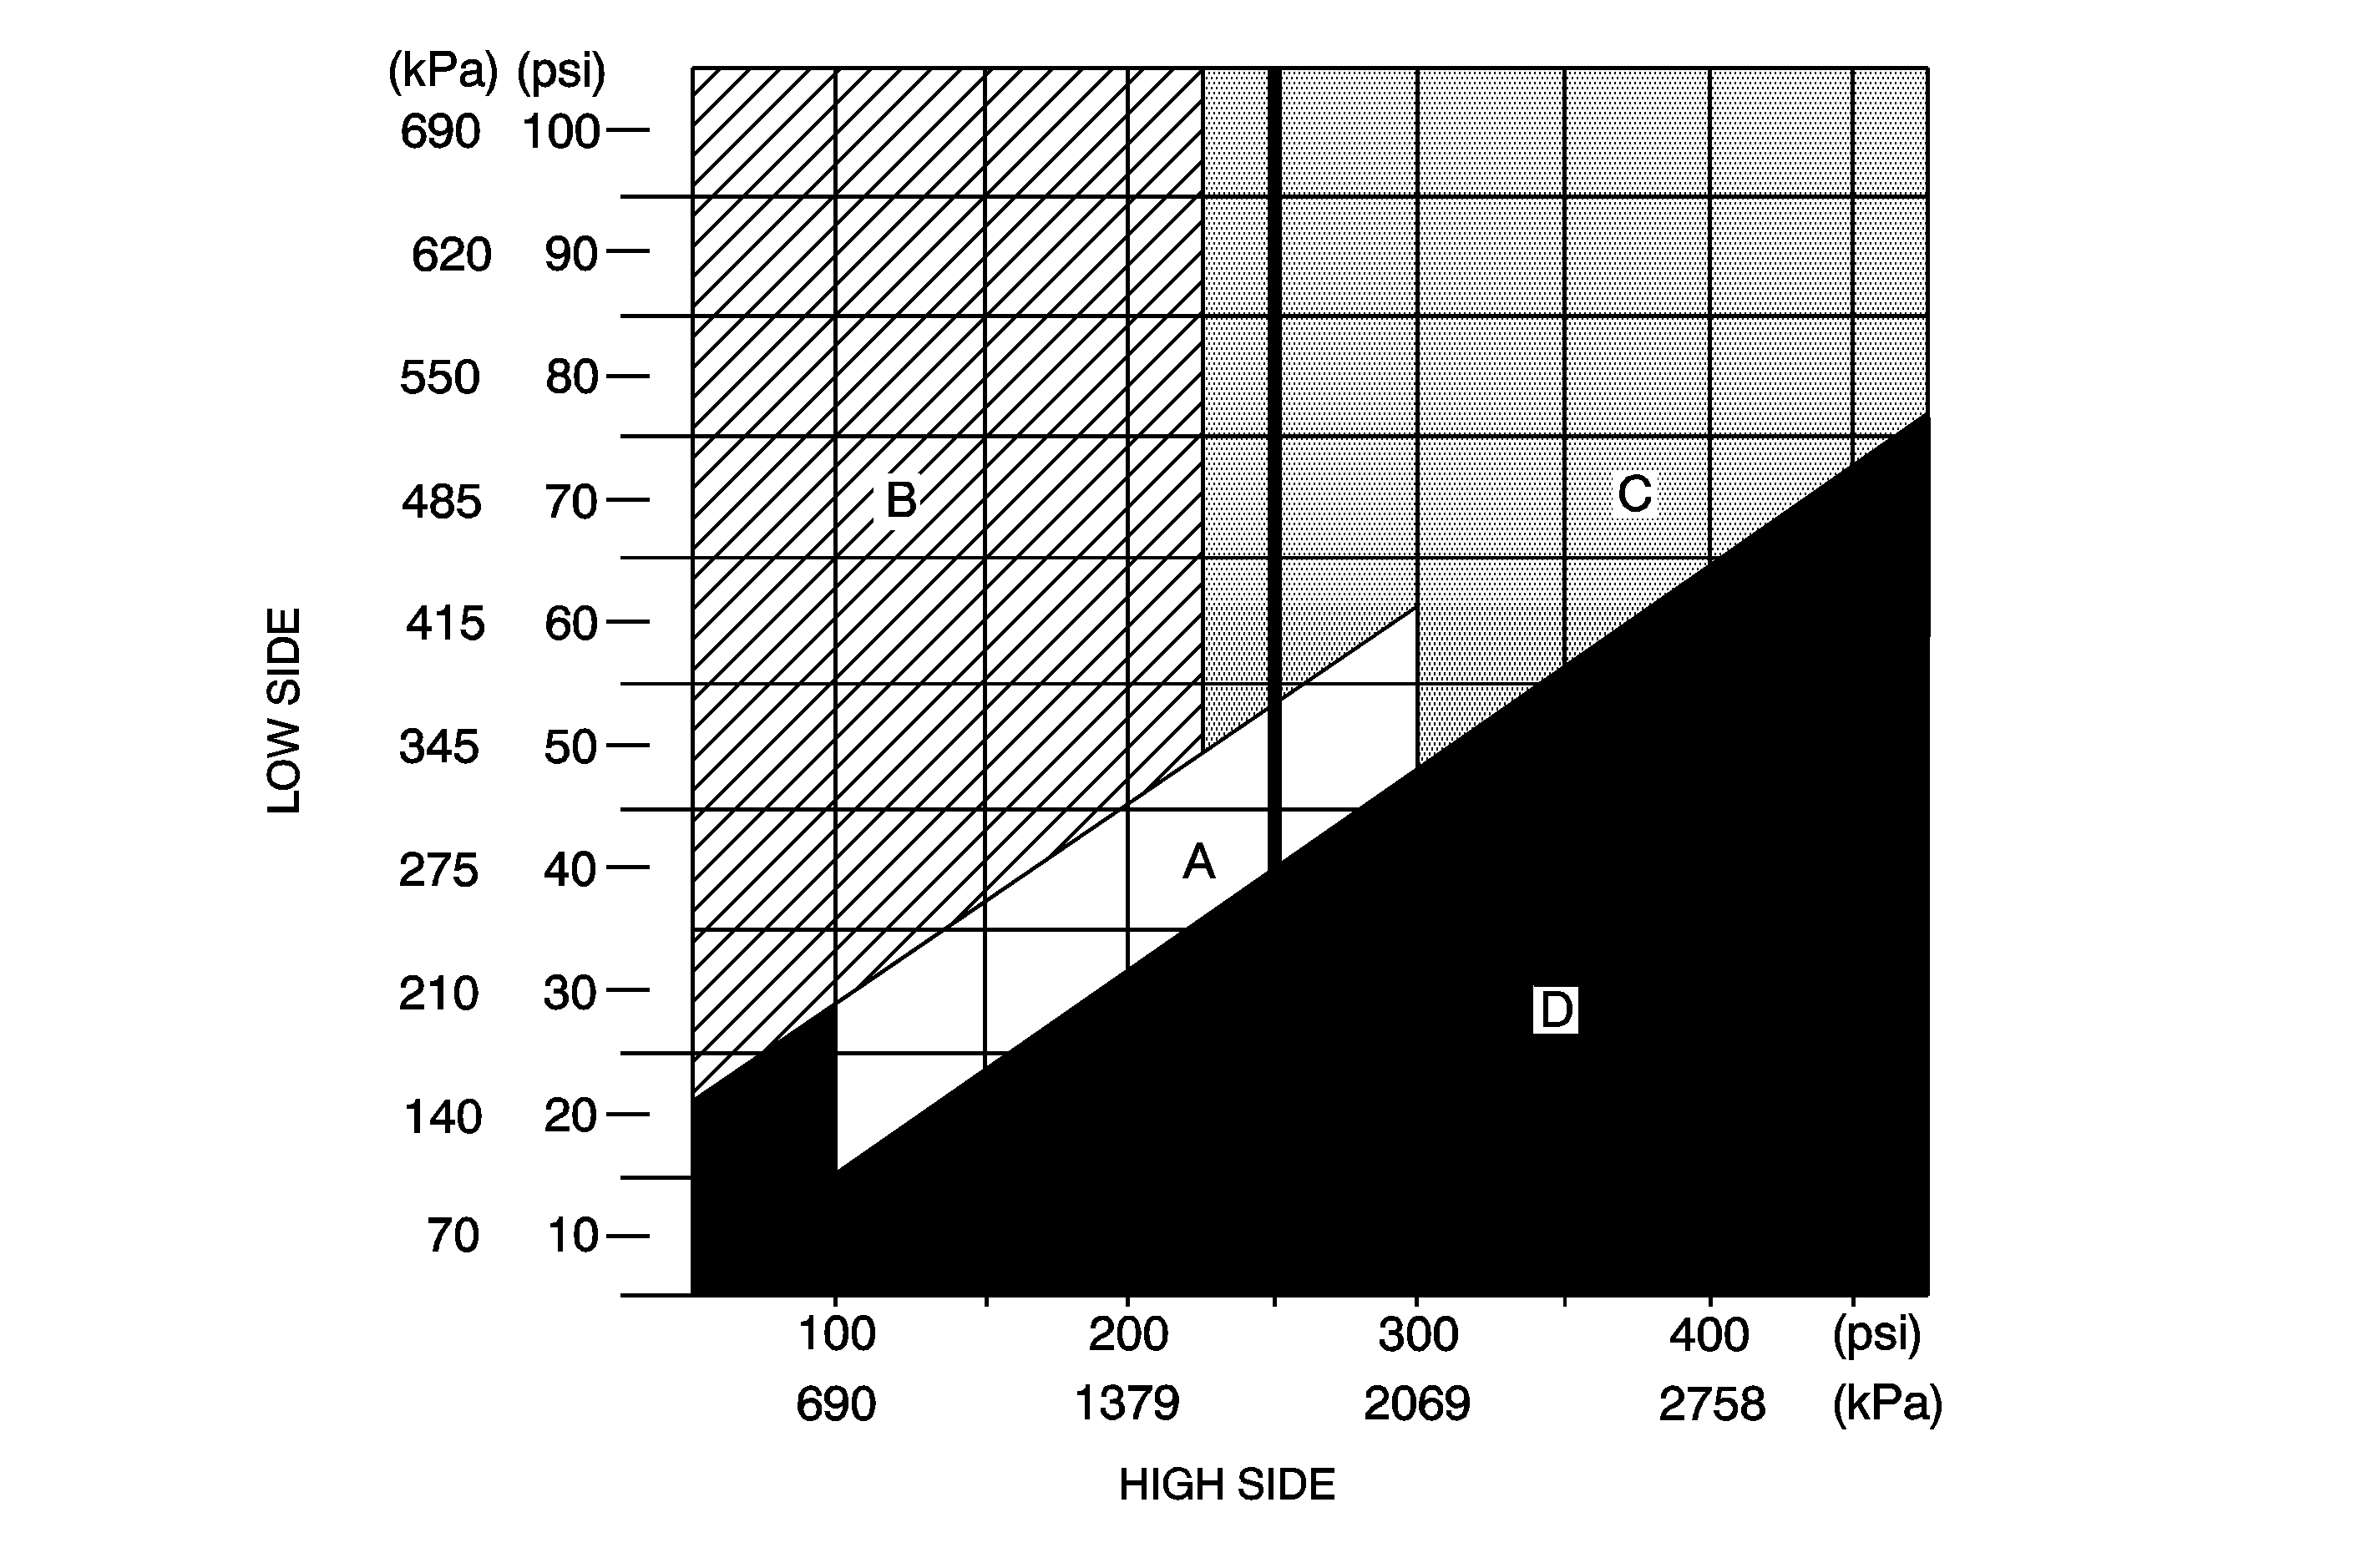
| Table 1: | A/C Performance Table |
Test Description
This test measures the operating efficiency of the A/C system under the following conditions:
| • | The current ambient air temperature (AAT) |
| • | The current relative humidity |
| • | The high side pressure of the A/C system |
| • | The low side pressure of the A/C system |
| • | The temperature of the air being discharged into the passenger compartment |
The numbers below refer to the step numbers on the diagnostic table.
-
This step determines if the A/C system has at least the minimum refrigerant charge required to operate the system without damage.
-
This step measures the performance of the A/C system.
-
This step is to allow for vehicle variations as well as high (AATs).
Step | Action | Values | Yes | No | ||||||||||||||||||||||
|---|---|---|---|---|---|---|---|---|---|---|---|---|---|---|---|---|---|---|---|---|---|---|---|---|---|---|
|
Important:
| ||||||||||||||||||||||||||
Are both the low and high side pressures within the specified value? | Above 16°C (60°F) - 345 kPa (50 psi) Above 24°C (75°F) - 483 kPa (70 psi) Above 33°C (90°F) - 690 kPa (100 psi) | Go to Step 2 | Go to Leak Testing | |||||||||||||||||||||||
Important: Record the relative humidity and the AAT AT THE TIME OF THE TEST.
Important: When performing this step it is necessary to press the RESET button on the J 43600 before pressing the PRINT button.
Does all the data recorded fall within the specified ranges of the A/C performance table? | -- | Go to Step 8 | Go to Step 3 | |||||||||||||||||||||||
If the pressures and temperatures recorded do not fall within the specified ranges:
Does all the data recorded fall within the specified ranges of the A/C performance table? | -- | Go to Step 8 | Go to Step 4 | |||||||||||||||||||||||
4 | Do the high and low side pressures fall within the specified ranges, but the panel outlet temperatures do not? | -- | Go to Step 5 | |||||||||||||||||||||||
5 | Is the low side pressure greater than the specified range, but the high side pressure is within or less than the specified range? | -- | Go to Step 6 | |||||||||||||||||||||||
6 | Are the low and high side pressures both greater than the specified ranges? | -- | Go to Step 7 | |||||||||||||||||||||||
7 | Is the high side pressure greater than the specified range, but the low side pressure is within or less than the specified range? | -- | Go to Step 8 | |||||||||||||||||||||||
8 | Operate the system in order to verify the test results. Did you find the same results? | -- | System OK | Go to Symptoms - HVAC Systems - Manual in HVAC Systems - Manual | ||||||||||||||||||||||
A/C System Pressure - Zone Classification

Ambient Air Temperature | Relative Humidity | Service Port Pressure | Maximum Left Center Discharge Air Temperature | |
|---|---|---|---|---|
Low Side | High Side | |||
13-18°C (55-65°F) | 0-100% | 175-232 kPa (25-34 psi) | 810-1 030 kPa (117-150 psi) | 12°C (53.6°F) |
18-24°C (65-75°F) | Below 40% | 175-245 kPa (25-36 psi) | 970-1 230 kPa (140-179 psi) | 11°C (51.8°F) |
Above 40% | 175-267 kPa (25-39 psi) | 960-1 200 kPa (139-175 psi) | 14°C (57.2°F) | |
24-29°C (75-85°F) | Below 35% | 191-268 kPa (27-39 psi) | 1 170-1 390 kPa (169-202 psi) | 13°C (55.4°F) |
35-50% | 202-274 kPa (29-40 psi) | 1 150-1 370 kPa (166-199 psi) | 14°C (57.2°F) | |
Above 50% | 210-287 kPa (30-42 psi) | 1 140-1 340 kPa (165-195 psi) | 16°C (60.8°F) | |
29-35°C (85-95°F) | Below 30% | 219-296 kPa (31-43 psi) | 1 330-1 580 kPa (193-230 psi) | 15°C (59.0°F) |
30-50% | 225-303 kPa (32-44 psi) | 1 310-1 550 kPa (190-225 psi) | 17°C (62.6°F) | |
Above 50% | 234-312 kPa (34-46 psi) | 1 290-1 510 kPa (187-220 psi) | 18°C (64.4°F) | |
35-41°C (95-105°F) | Below 20% | 250-326 kPa (36-48 psi) | 1 530-1 780 kPa (222-259 psi) | 18°C (64.4°F) |
20-40% | 253-329 kPa (36-48 psi) | 1 510-1 750 kPa (219-254 psi) | 19°C (66.2°F) | |
Above 40% | 260-333 kPa (37-49 psi) | 1 490-1 720 kPa (216-250 psi) | 20°C (68.0°F) | |
41-46°C (105-115°F) | Below 20% | 284-353 kPa (41-52 psi) | 1 720-1 940 kPa (249-282 psi) | 21°C (69.8°F) |
Above 20% | 286-354 kPa (41-52 psi) | 1 700-1 900 kPa (246-276 psi) | 22°C (71.6°F) | |
46-49°C (115-120°F) | Below 30% | 313-369 kPa (45-54 psi) | 1 860-2 020 kPa (270-294 psi) | 23°C (73.4°F) |
